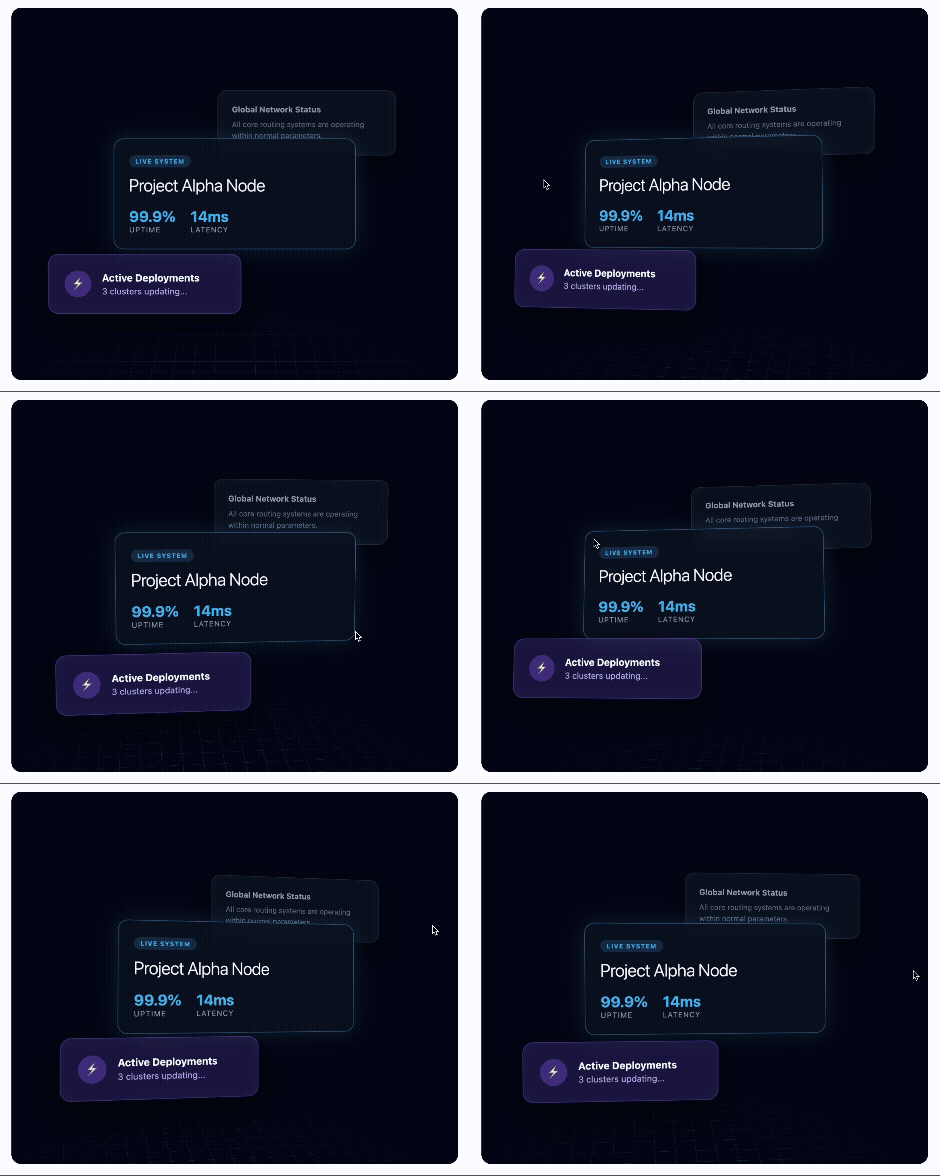
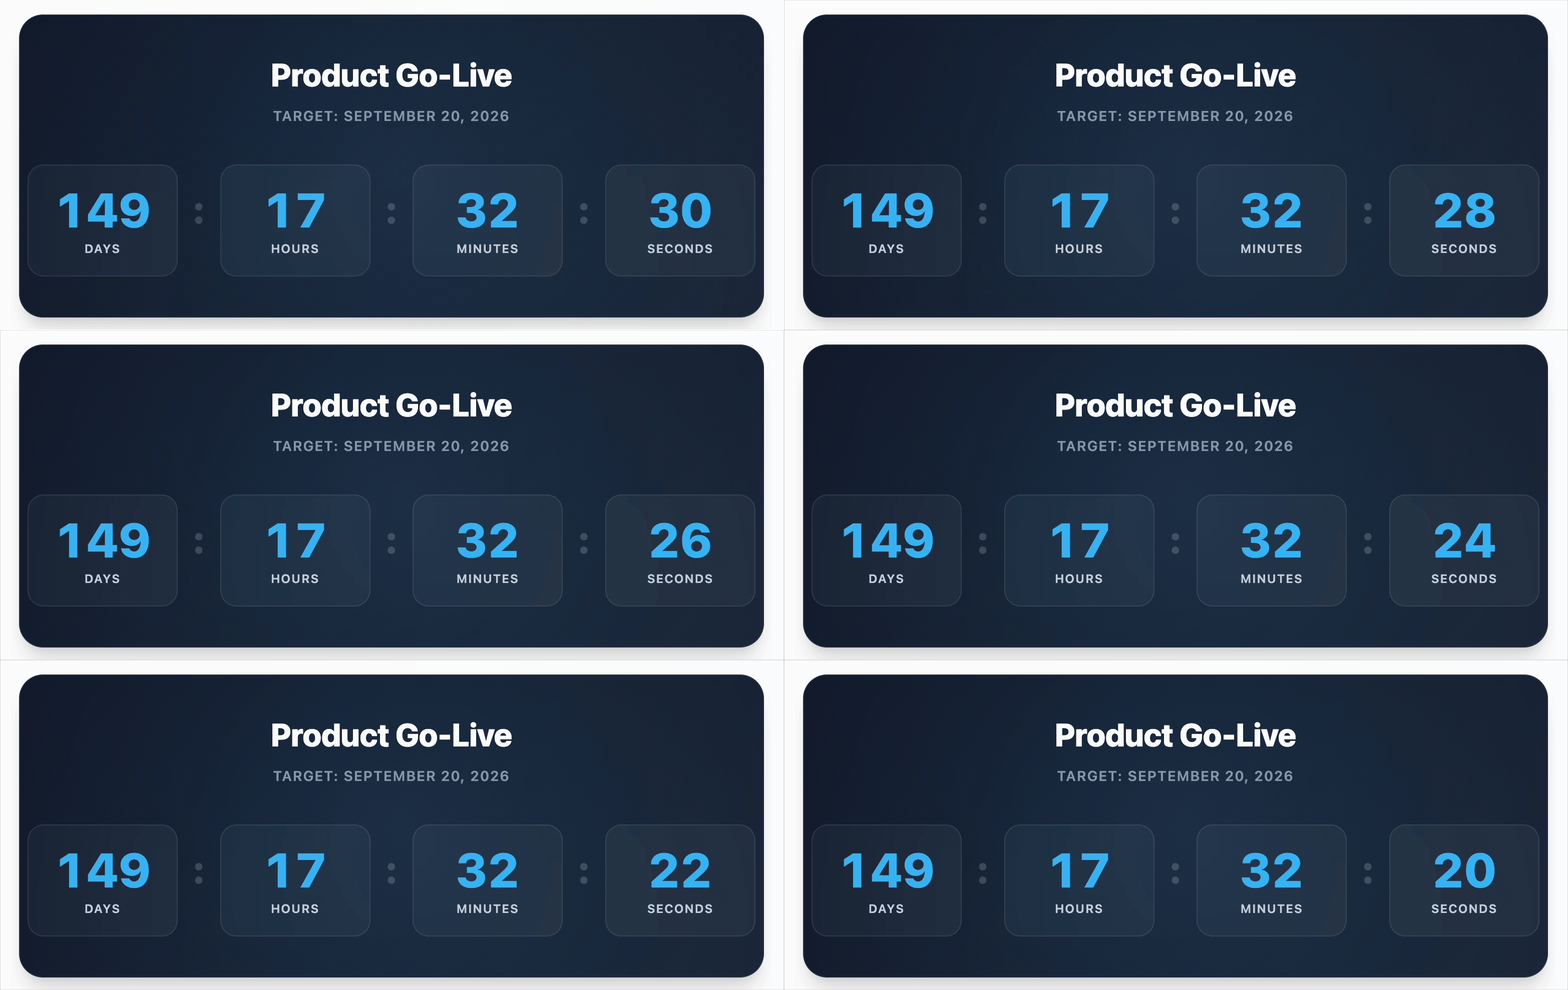
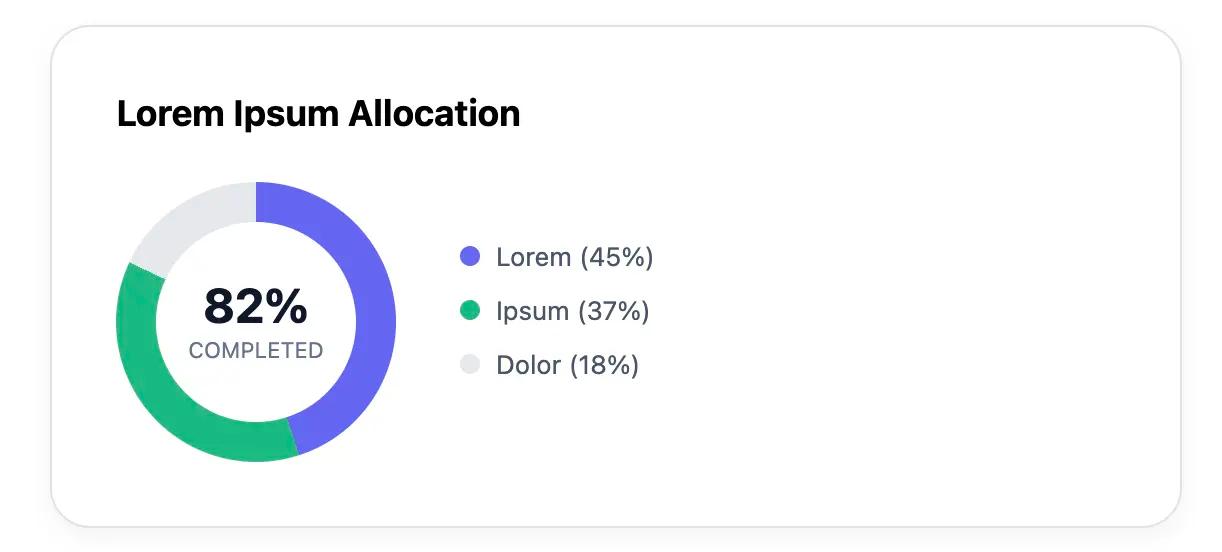
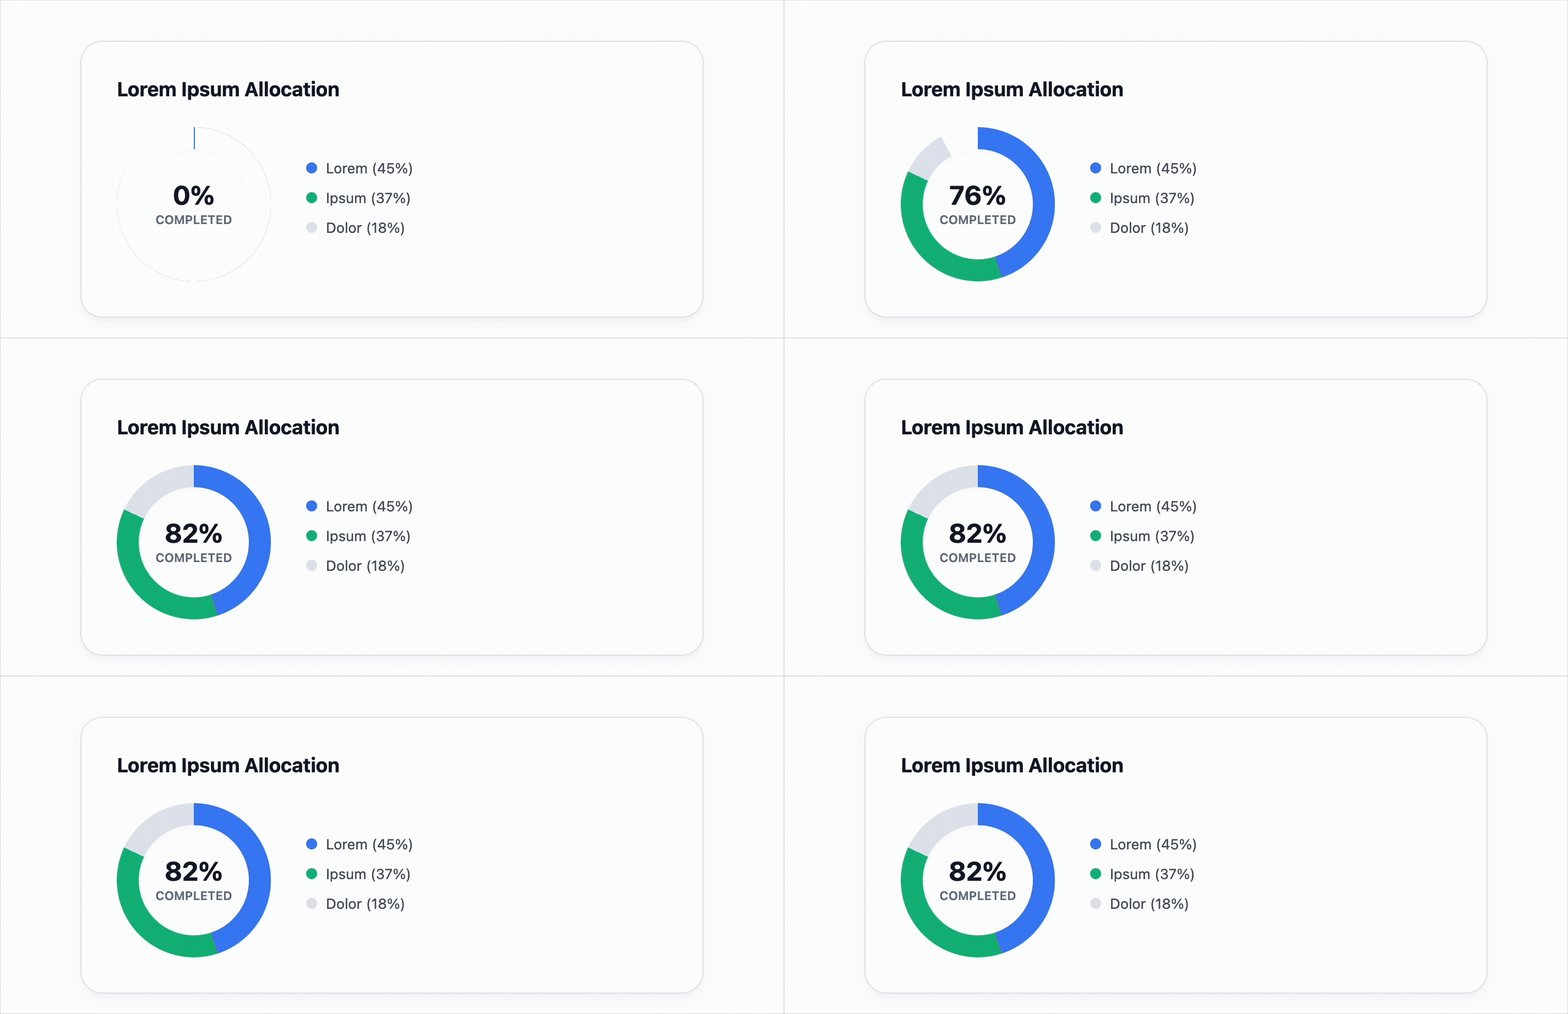
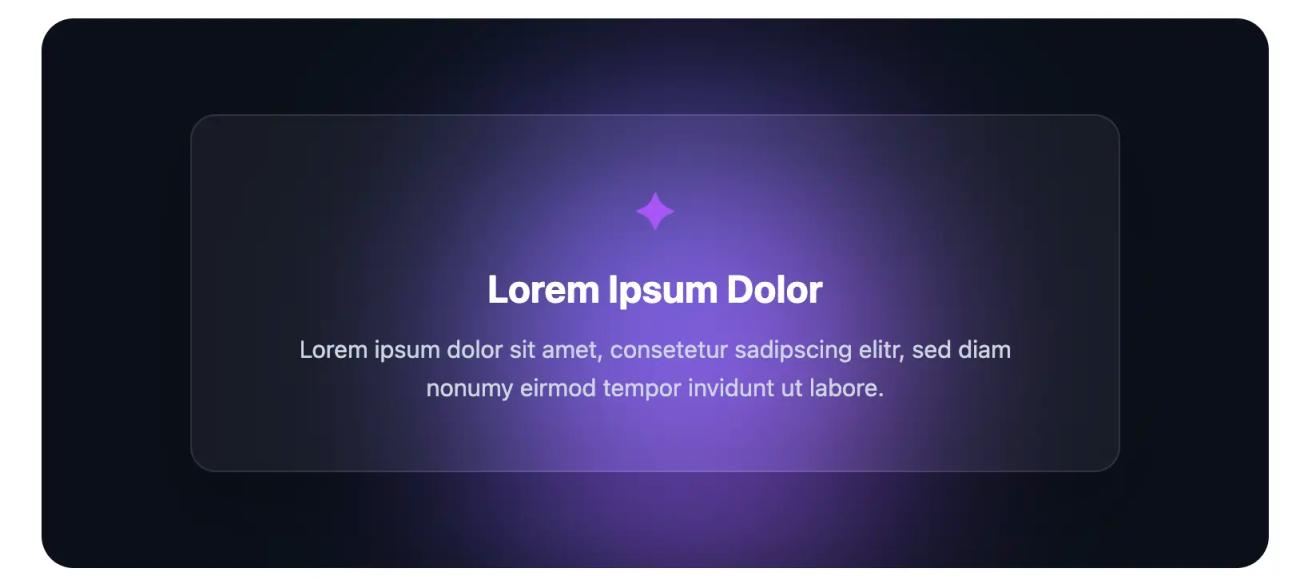
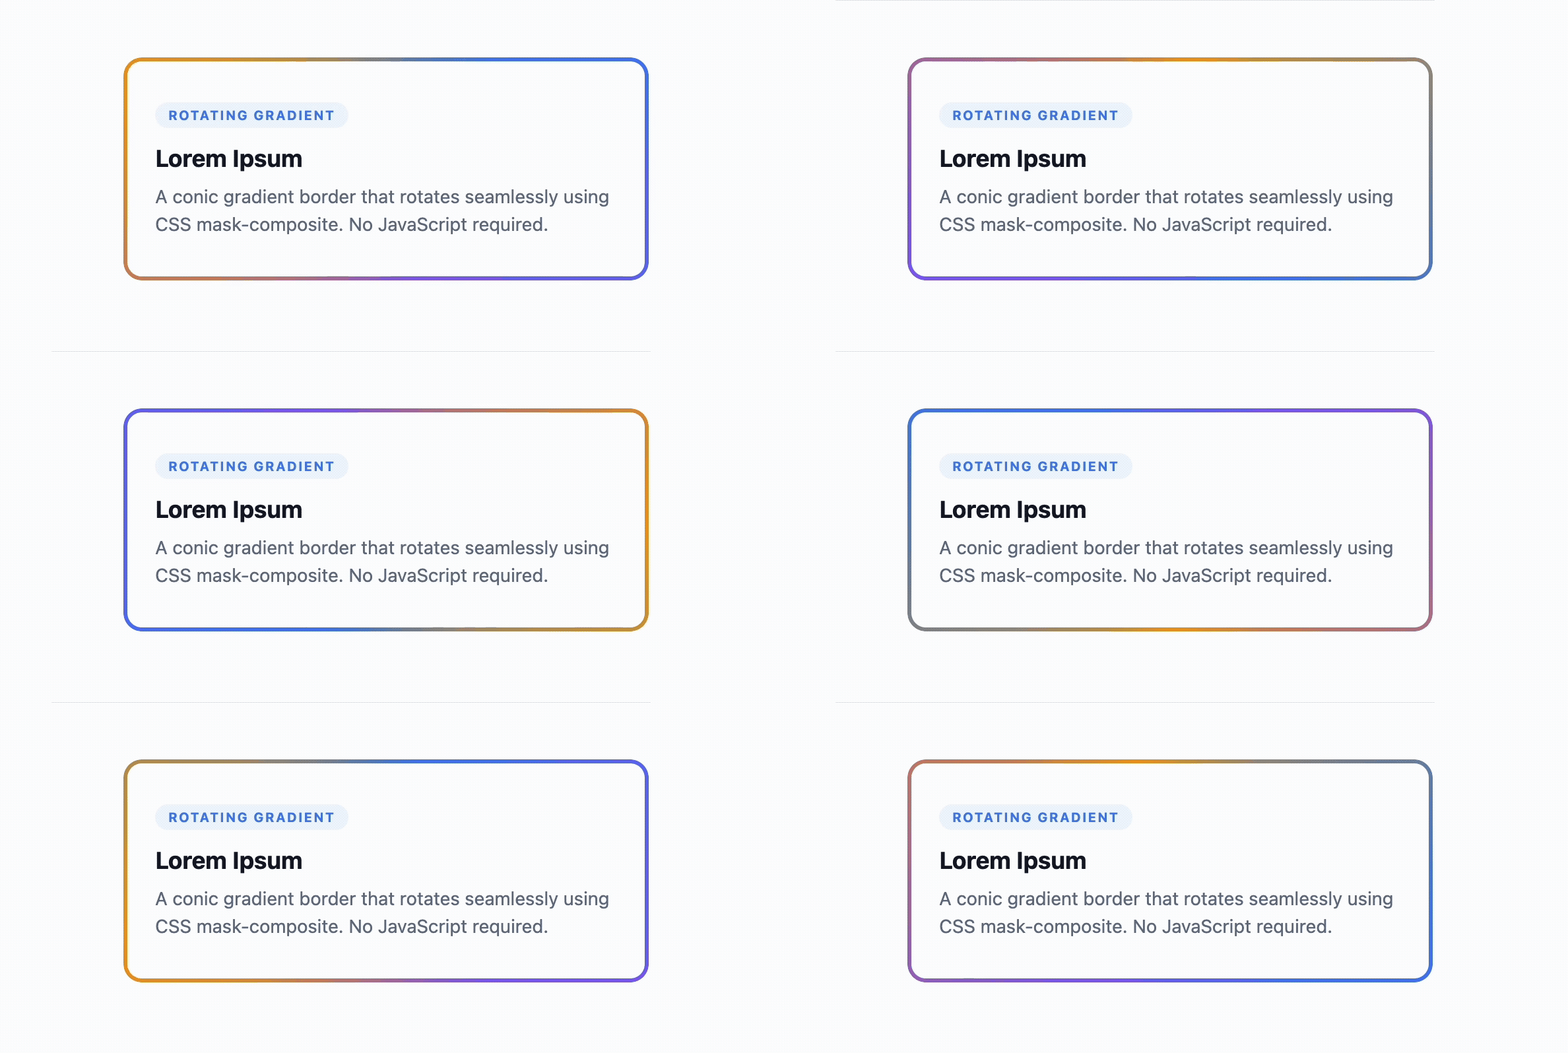
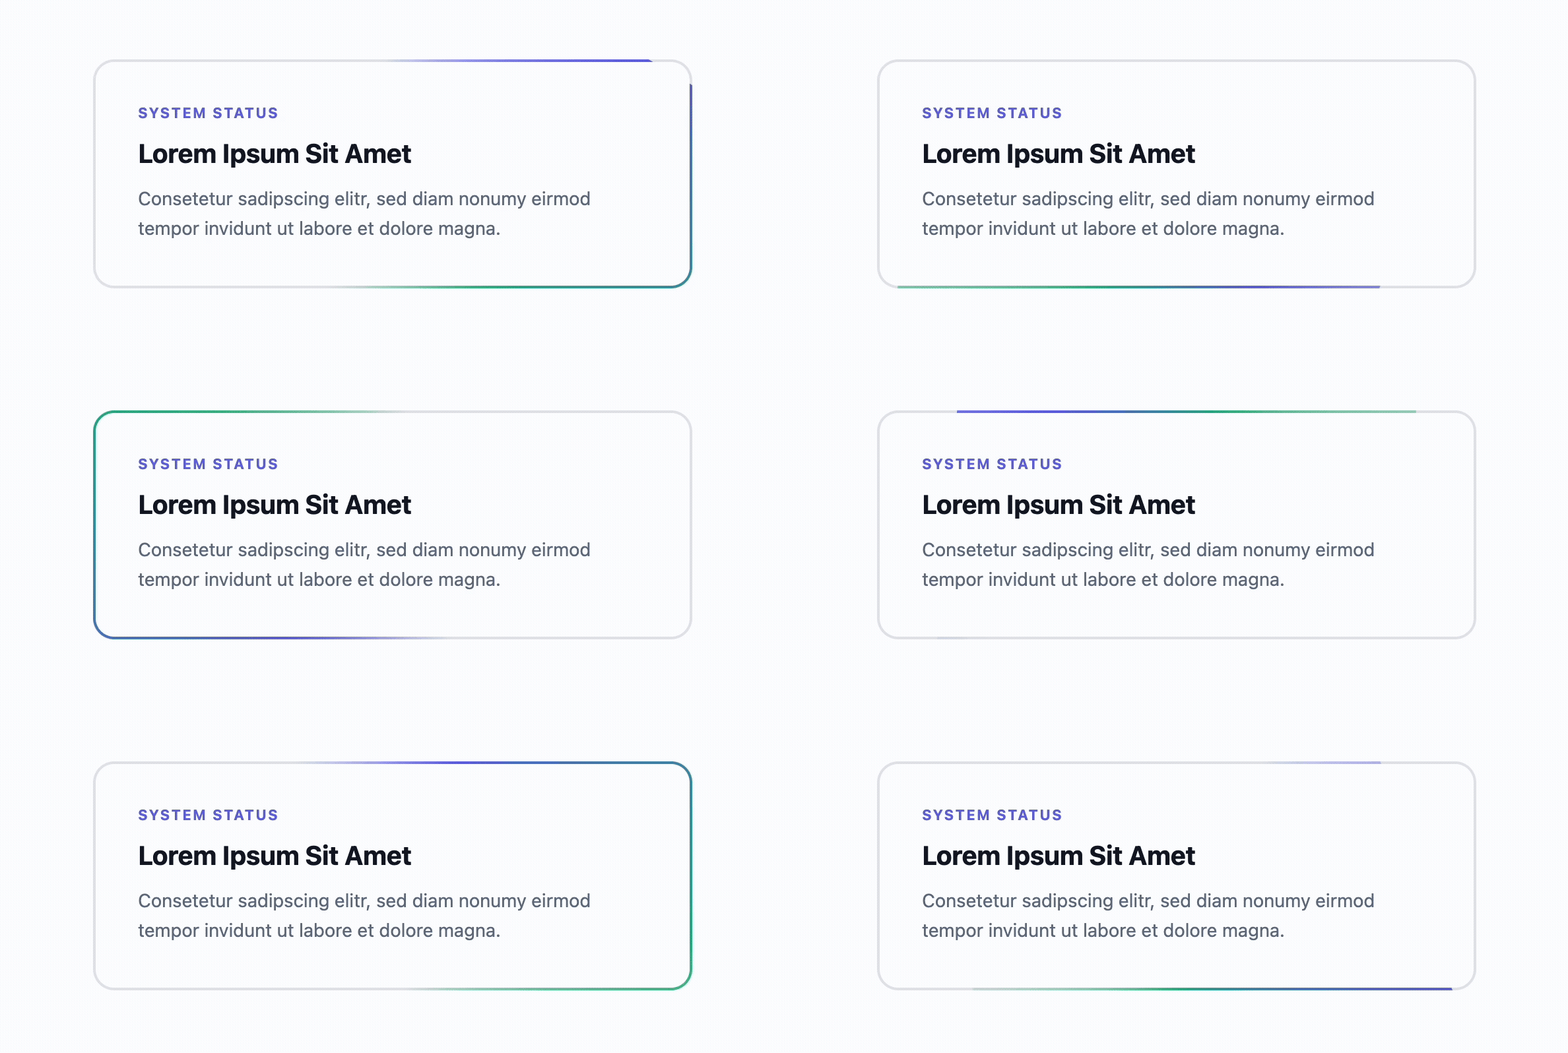
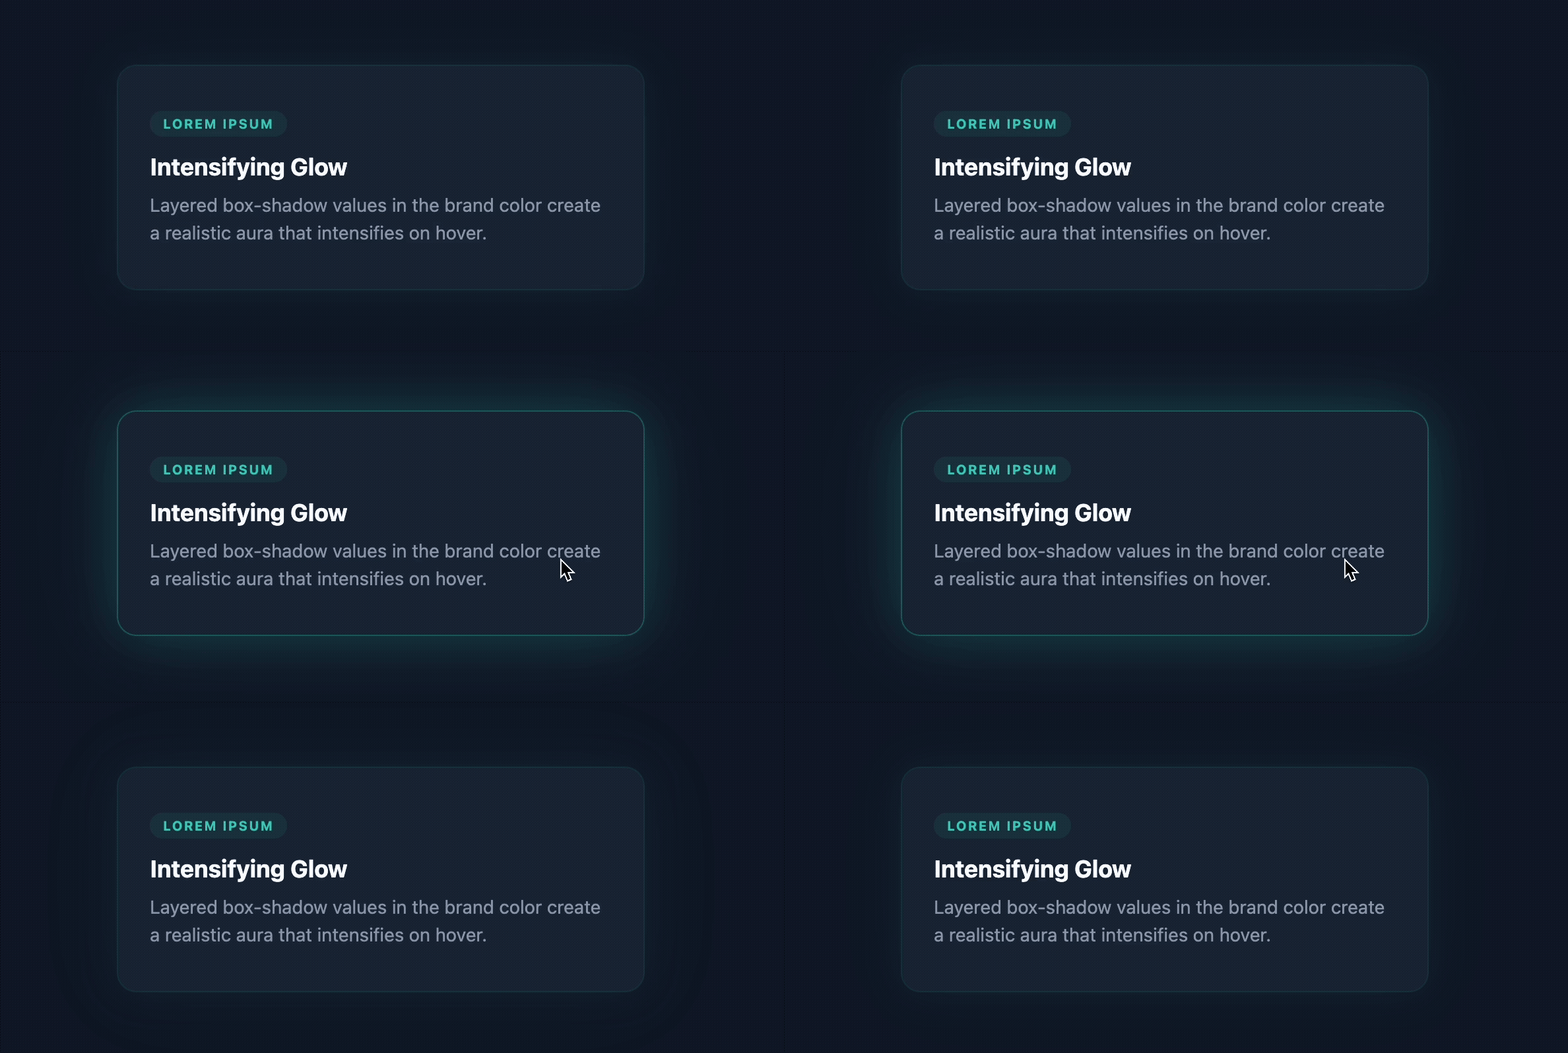
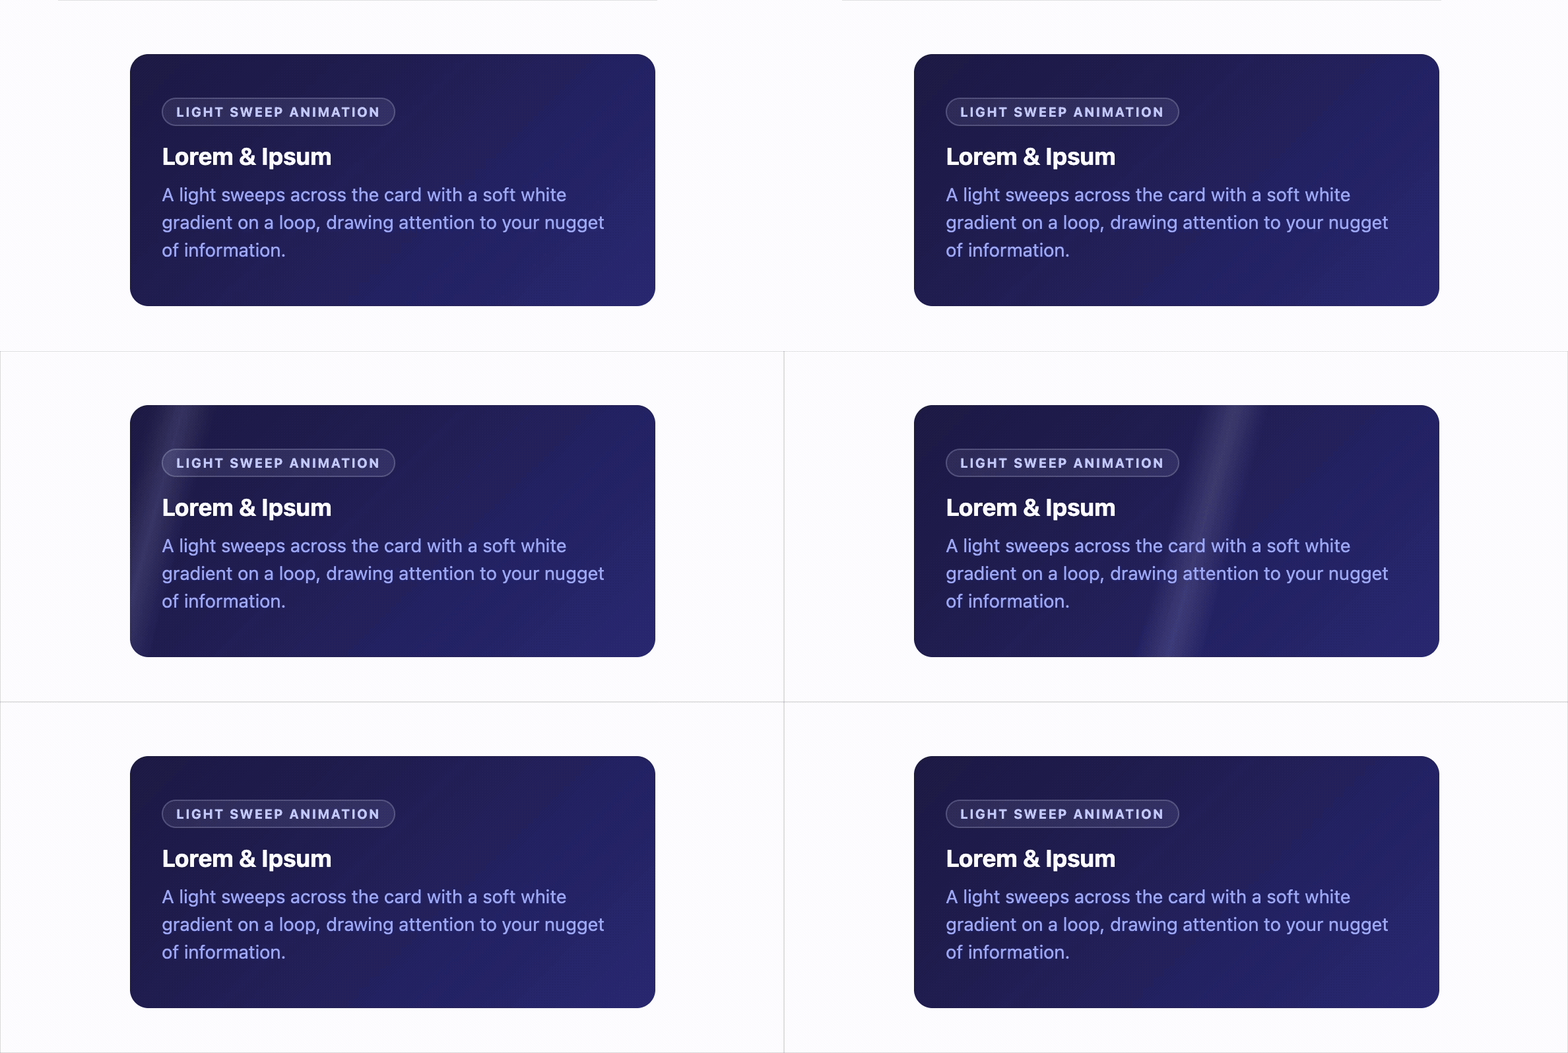
The core visual mechanics are defined in the CSS, utilising translateZ to pull elements forward (negative values) or push them back (positive values) on the Z-axis.
1. Defining the depth hierarchy (translateZ)
The "pop" of the display is controlled entirely by the CSS depth.
- To make a card "float" further away (background), decrease the translateZ value (e.g., -50px to -150px in .layer-bg).
- To bring a card closer (foreground), increase the translateZ value (e.g., 120px to 200px in .layer-fg).
CSS
/* Example: Pushing the background layer deeper for dramatic context */
.layer-bg {
transform: translateZ(-150px); /* Changed from -50px */
}
2. Customising the grid floor (holo-floor)
The floor provides the spatial anchor. If your dashboard uses a different brand palette than sky blue, adjust the floor grid colours.
Change the sky blue (rgba(56, 189, 248, 0.2)) to your preferred primary status or brand colour.
CSS
/* Customising the floor to a subtle green status grid */
.holo-floor {
background-image:
linear-gradient(rgba(16, 185, 129, 0.15) 1px, transparent 1px), /* Teal/Green */
linear-gradient(90deg, rgba(16, 185, 129, 0.15) 1px, transparent 1px);
}
3. Adjusting the mouse-tracking sensitivity (JS)
The 15 and -15 values in the JS determine how much the scene tilts in response to the mouse.
- Increase these values (e.g., to 30) for an exaggerated, rapid "holographic" responsiveness.
- Decrease these values (e.g., to 5) for a slower, more subtle spatial effect appropriate for high-traffic dashboards where excessive motion could become a distraction.
JS
/* JS sensitivity modification: Exaggerated spatial tilt */
const rotateX = (x - centerX) / centerX * 30; // Changed from 15
const rotateY = (y - centerY) / centerY * -30; // Changed from -15
By prioritising information and adjusting depth and responsiveness, you ensure the holographic 3D display is a functional tool for situational awareness, not merely a distracting effect.